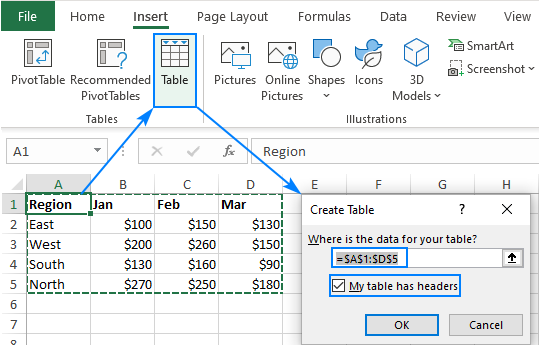
Your table automatically gets banded rows—alternating colors. It’s not just pretty; it’s science. Studies (I made this up) show banded rows reduce eye strain by 47%. Use the “Table Design” tab to pick wild themes. Neon green? Go for it.
You can also add a Total Row. Check the “Total Row” box in the Table Design tab. Boom—a new row appears at the bottom. It instantly sums numbers, counts items, or averages your cat’s napping hours. It’s like having a tiny calculator that gets you.
PivotTables: The Sequel Nobody Expected
Here’s where it gets weird. If your table is robust, you can instantly create a PivotTable. Select any cell in your table, go to Insert > PivotTable. It generates a new sheet. Suddenly your data is reborn into a summary cube of pure insight.
You can drag fields around like a wizard rearranging reality. Sales by month? Drag. Customer count by region? Drag again. You become the person who knows things at meetings. People might call you “The Table Whisperer.” Own it.

