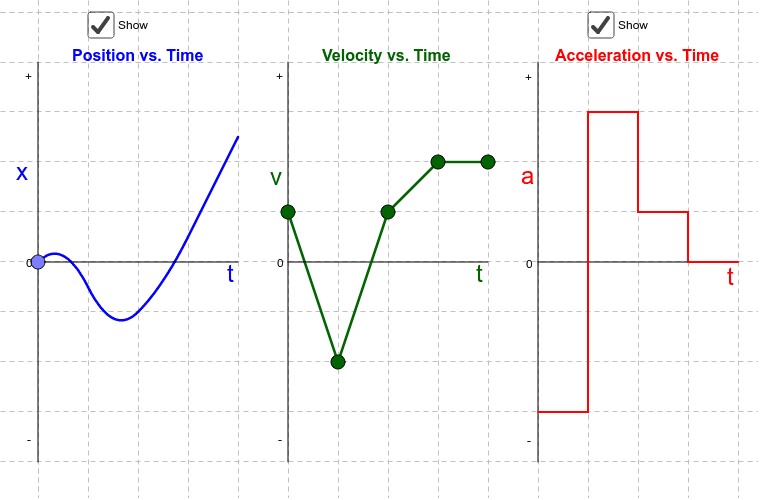
Imagine you walk to the coffee shop. Your position graph starts flat (you’re at home), then goes up (you walk), then goes flat again (you’re in line), then goes down (you walk back). What does the velocity graph look like?
First part: zero velocity (flat line at zero). Second part: positive constant velocity (flat line above zero). Third part: zero velocity again (flat line at zero). Fourth part: negative constant velocity (flat line below zero). Boom—you just turned a story into numbers.
Common Jokes (and Mistakes)
People often think that distance traveled is the same as velocity. Nope. Velocity cares about direction. If you go forward then backward, your velocity graph might average out to zero, but you still walked a ton. It’s like running on a treadmill—tons of work, zero net movement.
Also, don’t confuse the shape of the position graph with the shape of the velocity graph. A curved position graph doesn’t give you a curved velocity graph—it gives you a straight one if the curve is a parabola. Physics is sneaky like that.
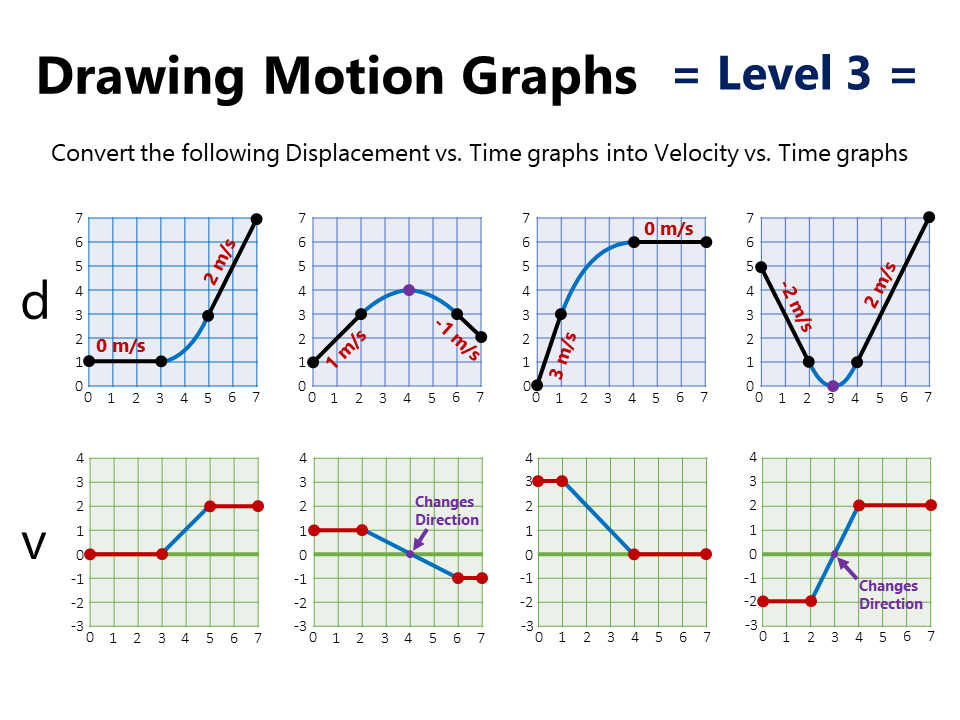 Velocity Time Graph And Position Time Graphs PhysicsLAB: Constant